
First time readers please click here
As mentioned earlier, while the prism holder was drawing the
sketch, the machine operator was setting up the total station.
He began by selecting the optimal location for mounting the
machine. Two guidelines were observed when selecting the
mounting location:
First, the tripod is mounted by driving its three pointed legs
firmly into the soil. Next, the total station is screwed into it.
Then the machine has to be leveled. This is not a
simple task. It involves two steps: the machine is lined up
flush with two of the three leveling knobs, and one of those two
knobs is adjusted to level position. Then the machine is
rotated 90 degrees horizontally, and the third knob is adjusted
to level position.
The data recorder is turned on, and the appropriate file is selected from a list of stored files. If the wall hasn't been surveyed before, a new file has to be created for it. In the case of wall W51.39, a file for the Macellum already existed. New data gathered on that day would be appended to the bottom of that file. Here is a sample from that file:
Pt.# X-coord. Y-coord. Z-coord. Comment:
This sample shows two consecutive points that are on the same
vertical line (similar X and Y coordinates) and are 10
centimeters apart (the difference between the Z coordinates).
1016 4812.0907 9931.6046 996.510 W51.39sequence
1017 4811.9231 9930.9408 986.135 W51.39sequence
The operator starts every new survey sequence with a new number that is a multiple of 100 or 1000. This makes it clear at which point a sequence of shots begins and ends. In the example of wall W51.39, the sequence of readings begins at point 1500; the last point recorded on that wall is 1562 (see sketch). The next sequence is started at point 2000, hence clearly distinguishing it as a separate sequence from that of wall W51.39.
The final step in the setup is the resection. Resection refers to the task of calibrating the machine so that the new sequence of points would be translated and recorded as part of the global coordinate system of all the data points in the model. Resection requires shooting at two previously recorded points - datum points -from the new position of the machine (A discussion of datum points follows in the next paragraph). The computer in the machine compares the new readings to the old, and through trigonometric calculations, relocates the machine in virtual space so that all new points are stored relative to the global system. This calibration process is transparent to the user and takes a fraction of a second to complete.
What are datum points: They are survey reference points selected in the beginning of every survey job. These points are assigned low numbers (between 1 and 99) to separate them from the daily-recorded points. They are also identified by letters. Datum points are carefully selected on the site on locations that will most likely last for several years. Typically, they are corners of marble steps, or notches on hard stone surfaces. The crew makes detailed sketches and descriptive notes in the notebook to pinpoint the location of these points in the forum.
The survey of the wall followed the resection. The prism holder chose points on the wall, held the back of the prism towards them pointing the reflective surface towards the total station. The machine operator aimed at the center of the prism and fired. In a few seconds, the space coordinates of each point were stored in the data recorder. The prism holder marked the location of each point on the sketch and assigned it the same number as the one assigned by the data recorder (see sketch detail below).
In some instances the points desired were within the range of the total station, but were blocked by other objects in the path of the beam shot from the total station. The survey crew devised inventive methods to deal with such instances. Following are some specific examples:
1- The point desired was on a corner of a quoin hidden by plaster. The crew deduced the coordinates of that point by combining the x and y coordinates of a visible point on the same vertical line, and the z coordinate of a visible point at the same elevation.
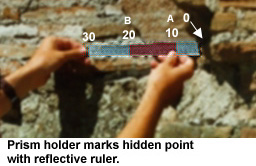
2- The path line from the total station to the desired point was blocked by a stone or other large object. A gadget was devised to deal with this situation. This gadget consists of a clear plastic ruler marked in centimeters, with reflective tape pasted to its rear side. In previous seasons reflective tape was tested as an alternative to the prism and the results were satisfactory for the crew to use it as a substitute to the prism when necessary. Positioning the zero mark of the reflective ruler on the desired point and holding the ruler vertical allowed the machine operator to aim at a visible mark on the ruler. By subtracting the vertical distance between point zero and the point shot by the machine, the crew was able to deduce the desired point.
Another way to deduce a hidden point was by
positioning the zero mark on that point and holding the ruler so
that enough of its length was visible to the machine operator.
The reflective ruler had yet another important role. By fastening it to the top of an ordinary fishing pole, the crew was able to position it from the ground at the top of walls that would otherwise have required a ladder to reach. Using a ladder can be inconvenient and time consuming because it had to be moved every few feet when surveying a long wall. Using the fishing pole, the prism holder pointed the ruler at the desired point from the ground and the machine operator aimed at the ruler. In some cases when the prism holder couldn't locate the desired point from his position, the machine operator, using the telescope lens of the machine, aimed at that point on the wall first, and then guided the prism holder to place the ruler on the point. Once a point was shot by the total station and recorded by the data recorder, the machine operator added remarks in the comment column to describe it. These notes often duplicated the remarks taken by the prism holder in the notebook. This duplication was a good verification system during the construction of the model on CAD. This process of aiming at and recording points was repeated a few hundred times until enough points to construct the wall on CAD were gathered. Work ended at about 1:00p.m. The crew packed the equipment and headed back to the hotel.
The crew gathered in the room that doubled as the CAD work-center. The first item on the agenda was equipment maintenance. Even though the disk space on the data recorder was fairly large, the bigger the data file being used became, the slower the machine responded in recording point information. It was necessary, therefore, to flush the contents of the data recorder every few days: the files stored on the data recorder were downloaded to the computer via the Winsurv software and a serial cable, then a copy was made of the active survey file (the one being used at the time) and given a new name (for example, the Macellum files were named mac-1, mac-2, etc.) All recorded points were deleted from this file except the datum points described earlier (see section on survey work). The trimmed down file "mac-2" was then uploaded back into the data recorder and used the following day.
Then CAD work began. The first step was to download the data file created during the day from the data recorder into the computer. The data, which were transferred to the PC through the serial cable and Winsurv as described above, appeared in raw form--a format that contained information usable only by the software. A translation from that format to the Coordinate System format (.CRD) had to be performed before the data could be used by AutoCAD. This translation was also achieved using the software Winsurv. After the translation was complete, the data were ready to be exported to AutoCAD. The operator sent the data to AutoCAD in small batches of points rather than in one large cluster; this made the process of constructing the model less overwhelming. The notebook was very useful in making the selection of the batches because it contained information describing the points that defined the walls surveyed. The CAD operator selected the points and converted them to either DXF or script, the two export formats recognized by AutoCAD. In this example the operator used the DXF format. Then AutoCAD was invoked (because the operating system used at the site was Windows 3.1, the operator was able to run both AutoCAD and Winsurv concurrently and switch between the two). Once AutoCAD was started, the Macellum file which already existed and contained walls created in previous days, was brought up on the screen. The operator, who knew the location of the wall within the building, zoomed in on the approximate area of that wall, and through AutoCAD's file import utilities, inserted the DXF file. In Winsurv the content of the file was textual ( a list of numbers describing the X, Y and Z coordinates of each point). In AutoCAD, when the DXF file was inserted, its contents were automatically translated into points in three-dimensional space, each represented by an X symbol and a number that appeared below it; that was the same number generated by the data recorder and entered in the sketch book by the prism holder (see the section describing the work on the site). It was often the case that when a batch of points was inserted in the model, it was easily confused with all the existing lines and objects. Only through the notes taken during the surveying was the CAD operator able to effectively make use of the points.
After the batch was inserted, the model construction process began. The operator used 3D-polylines to connect the points and to create the wire-frame model, relying heavily on the information recorded in the notebook. The term "wire-frame" meant that the wall in question was represented as a see-through skeleton. Creating the skin that covered the skeleton was achieved by attaching 3-D faces to the polylines (A 3D-face entity is an opaque polygon made of either 3 or 4 sides). The number of faces used to cover a wall was directly related to the level of detail that the wall was surveyed with. The more simplistic the surveying, the easier it was to represent it in CAD. Due to the importance of detail in the study of the forum of Pompeii, the surveying was done at a very high level of precision, and the building of the model was therefore no simple task and required careful planning before the 3D-faces were inserted.
Once the points inserted were all used, they were erased from the model, and a new batch was brought in. The process of connecting the points with polylines, adding the 3D-faces, erasing the points and inserting a new batch was repeated several times until all the walls that were surveyed in the morning were modeled in the computer. The file created by Winsurv which contained the source for all the points was then given the date of the day as a name, and was archived in the storage disk along with files from previous days. This method of naming the files simplified the task of searching the archives when specific information was needed. The user scanned the notebook for the desired information, used the date that appeared at the top of the page as reference, and located the file that matched that date. Computer work ended when all the points were used in the model.